
AI-driven multi-asset strategy · Special edition
When the News Turned on Big Tech: How the US Longs Were Closed and Flipped Short
Special edition · 7–16 October 2026
On 7 October the MoodVector news score for US indices dropped from neutral to deep negative and stayed there while the Nasdaq slid for nine days. On 16 October the strategy closed its US longs and turned short. Here is the story, headline by headline, with every trade you can check on MQL5.
Download the PDF report01 · The story
Nine days of warnings, one decision
US stocks started the month at record highs. Then the headlines changed. First Treasury yields, then a Fed governor talking about more hikes, then a hot inflation report and a rout in chip and AI stocks. MoodVector reads these headlines as they arrive and scores each one for its likely impact on every index it tracks. This is what it saw. Times are UTC.
- S&P 50 → 23
Off record highs as Treasury yields climb. “US market ends lower, off record highs, as Treasury yields climb” and “Wall Street falls as Treasury yields climb” arrived at 20:10. The S&P 500, Nasdaq and Dow scores all dropped into the low 20s within an hour. What we did: held its US longs and watched.
- S&P 23 → 31
A Fed governor says more hikes are needed. “Fed’s Waller says more hikes needed” and “S&P 500, Nasdaq end lower as crude prices jump, chip stocks weigh”. The score stayed deep in negative territory. What we did: held.
- Nasdaq briefly ~80
A short-lived AI bounce, then the Middle East. AI data-centre headlines lifted the scores for a few hours. Evening attacks on Riyadh airport pushed them back down over the weekend. One headline can move the score, so the strategy waits for a move to persist. What we did: ignored the spike.
- scores 25–35
AI-bubble talk and an escalating conflict. “AI’s circular financing loop … 2008 comparisons are back”, “Beware the A.I./data center bubble”, and Saudi strikes on Sanaa with Houthi threats against Aramco. Some good news (Microsoft back at a $4 trillion market value) was outweighed. What we did: held; the scores never got back to neutral.
- Fear & Greed 45 → 29
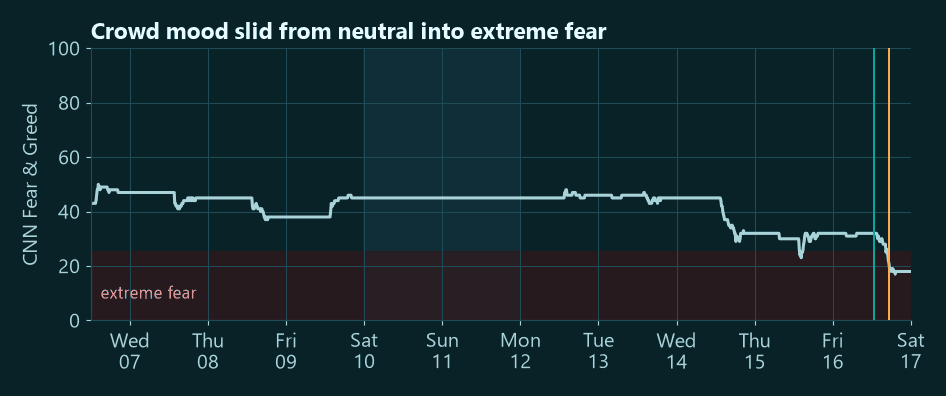
The hot inflation report. “US equity indexes fall as Big Tech sinks after hot inflation report lifts odds of three Fed rate increases”, “Chip stocks head for 7th straight losing session”, “Stocks drop to their worst day since July”. What we did: kept holding, but its combined score for the US indices (news, crowd mood and price) fell to about 25. This was the turning point.
- Dow +450 points
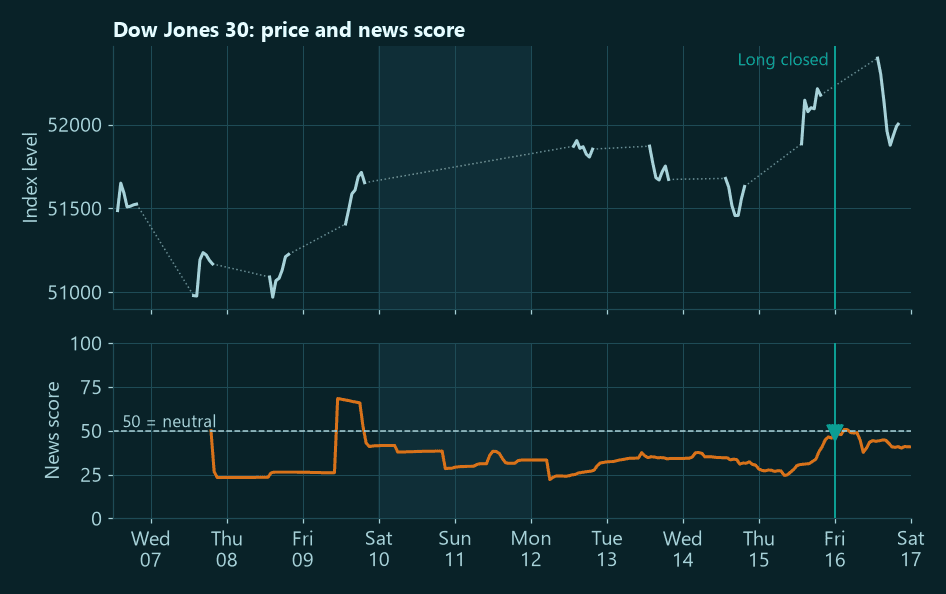
The AI unwind spreads, and the Dow decouples. “Korea stocks tumble 8% as investors rush to unwind AI exposure”, “84% of S&P 500 stocks are now in correction territory” — while “Dow jumps 450 points as yields dive” as money rotated out of tech. What we did: overnight its target for the S&P 500 and Nasdaq turned short; the Dow long was closed at 23:59, near the top of that rally.
- Fear & Greed 32 → 19
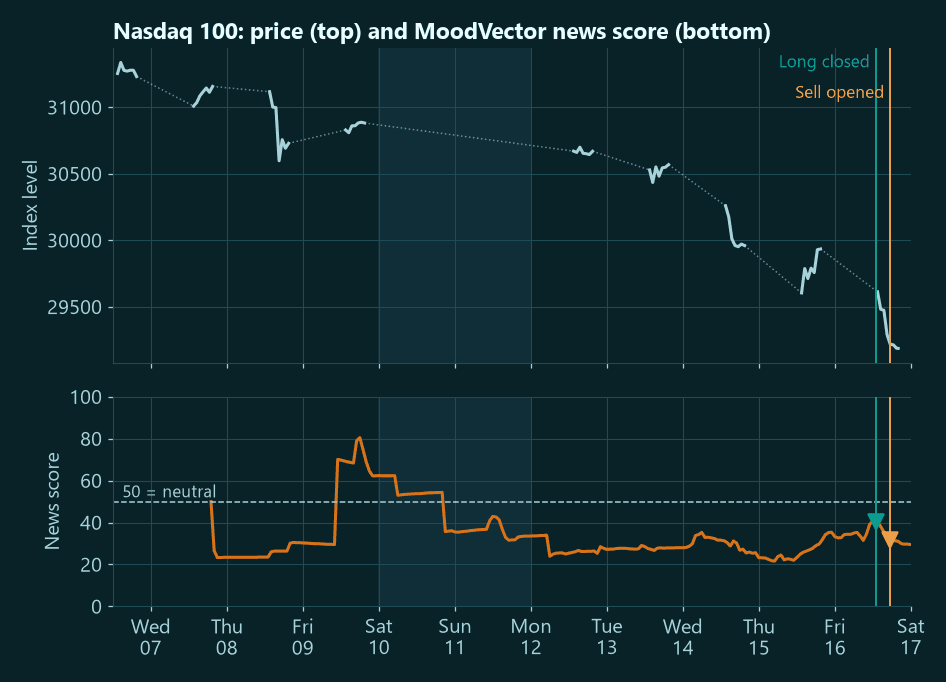
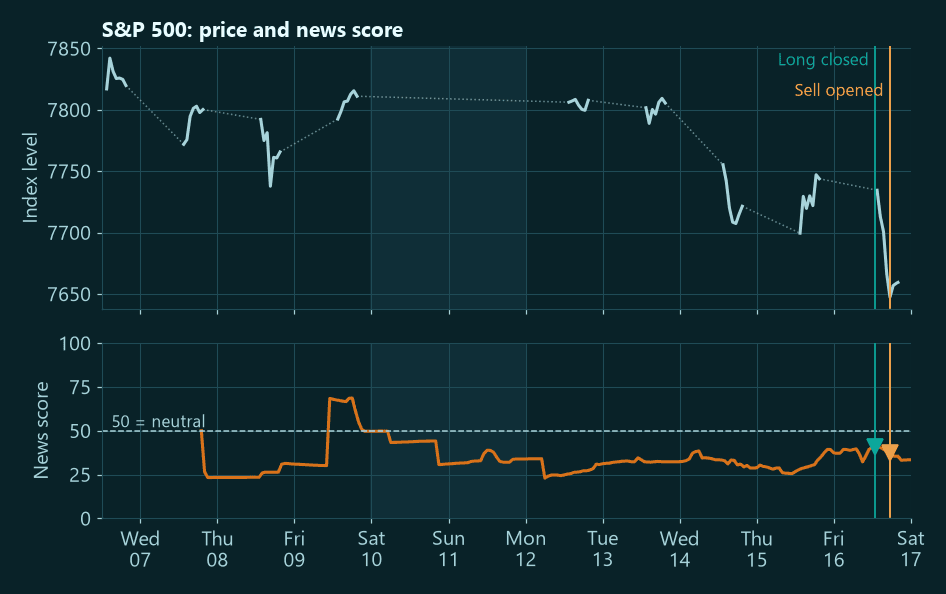
Exit, then turn. “There’s a 35% chance the Fed hikes at least 4 times by September 2027”, “S&P 500, Nasdaq break key levels as CoreWeave, Dell dive”, “The Nasdaq saw its worst week in months”. What we did: closed the S&P 500 and Nasdaq longs at 12:49 and 12:59, then opened sells in both at 17:24 and 17:33 as the crowd slid into extreme fear.
02 · The signal on the chart
Score first, price after
The orange line is the MoodVector news score: below 50 means the news flow is negative for that index. It turned on Wednesday evening and never got back above neutral, apart from Friday’s brief AI bounce. The Nasdaq ground lower for the rest of the period and closed the week about 680 points below the exit.
03 · The trades
Every trade, as shown on MQL5
These are the US trades of the public MoodVector Navigator signal, exactly as they appear in its trading history on MQL5 (MQL5 time is the broker’s server time, UTC+3). The longs had been built over the summer and were closed in full.
| MQL5 time | Index | Action | Price | Result, % of equity |
|---|---|---|---|---|
| 16 Oct 02:59 | Dow 30 | Long closed | 52,403.33 | −0.20% |
| 16 Oct 04:01 → 14:29 | Dow 30 | Small buy, then closed | 52,257.70 → 52,399.90 | +0.13% |
| 16 Oct 15:49 | S&P 500 | Long closed | 7,703.15 | +0.19% |
| 16 Oct 15:59 | Nasdaq 100 | Long closed | 29,889.96 | −0.65% |
| 16 Oct 20:24 | S&P 500 | Sell opened | 7,662.62 | −0.01% (open) |
| 16 Oct 20:33 | Nasdaq 100 | Sell opened | 29,349.52 | +0.73% (open) |
- Closed: the US trades closed at roughly break-even on price (−0.53% of equity in total). Holding them since the summer also cost −1.59% in overnight financing (swaps).
- Avoided: had the longs simply been held to Friday’s close, they would have lost a further ≈ 15% of equity: Nasdaq ≈ 9.5%, Dow ≈ 3.5%, S&P 500 ≈ 1.9%.*
- Open: the new S&P 500 and Nasdaq sells were +0.72% at Friday’s close.
04 · Straight talk
What worked, and what didn’t
- The warning came early. The news score turned bearish on 7 October, while the S&P 500 was still near its record — nine days before the exit.
- The exit came later. The strategy waits for its combined score and the crowd to confirm. That kept it from reacting to every headline, but the Nasdaq had already fallen about 4% from 7 October by the time the long was closed. The remaining 2.3% of the fall was avoided.
- Not every index followed the news. The Dow rose 1.6% over the same days as money rotated out of tech. Closing it near Thursday’s high still worked out, but the score alone did not call that move.
- One headline is not a trend. Friday 9 October’s AI-optimism spike lasted hours. The strategy ignored it, which was the right call.
05 · What we're watching
Next week
- The Fed. Rate-hike expectations after the hot inflation print, and any guidance on the next move.
- AI and chip stocks. Whether the rotation out of tech continues, or the “washout rally” calls prove right.
- The Middle East. Attacks on Saudi Arabia and shipping in the Strait of Hormuz, and what they do to oil.
- The scores themselves. The sells stay open only while the scores keep confirming.
Follow every trade live
The strategy behind this report runs live with a public, independently tracked record on MQL5.
*“Avoided” figures are hypothetical: they compare each long’s exit price with the index CFD’s price at Friday’s close (Dow estimated from the cash index) and are not realised results. Results are for the public MQL5 signal account, as a percentage of its equity. US indices only; European and Australian positions are not covered in this edition.
This newsletter is for information only and is not investment advice. Trading leveraged products such as CFDs carries a high risk of loss. Past performance does not guarantee future results, and floating results on open positions can change materially before they are closed.