
AI-driven multi-asset strategy · Weekly brief
MoodVector Weekly: Dovish Data vs. $100 Oil and Systematic Equity Scaling
Week of 30 September – 7 October 2026
The news turned risk-on, and the strategy scaled in with it. Oil kept a lid on Europe, so part of the book is still waiting for its move — but account equity finished the week higher.
Download the official Weekly PDF report01 · The market
A tug-of-war: dovish data versus $100 oil
Two stories ran side by side all week. In the US, data kept coming in soft — a cooler PCE inflation print on Wednesday, then a weak jobs report on Friday — and markets read both as reasons for the Fed to stop hiking. The S&P 500 and Nasdaq 100 ground higher and set fresh record highs on Tuesday, helped by an AI-led rally and easing Treasury yields.
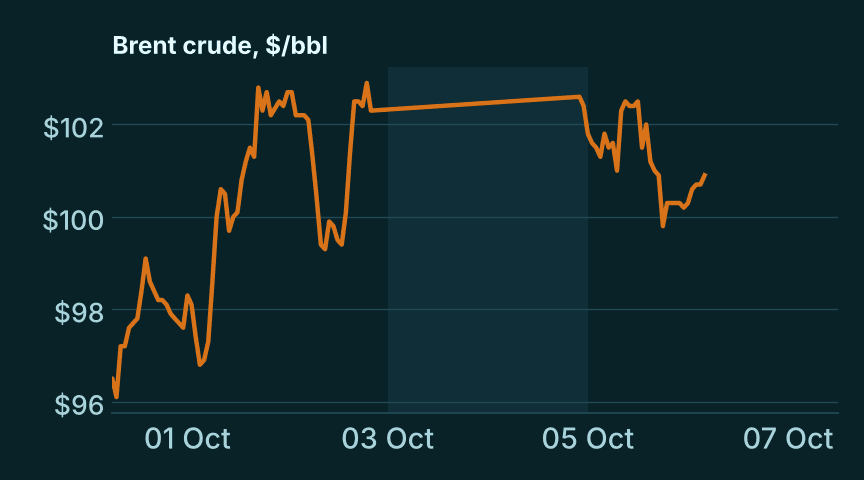
At the same time, Middle East tensions and disruption around the Strait of Hormuz pushed Brent Crude from about $96 to above $101, with Aramco and the EIA both warning that global oil stocks are running low. Higher energy costs weigh hardest on Europe, and it showed: the FTSE 100 and DAX 40 finished the week lower even as Wall Street rose.
| Index | Week |
|---|---|
| Nasdaq 100 | +2.2% |
| S&P 500 | +1.4% |
| Dow Jones 30 | +0.4% |
| ASX 200 | 0.0% |
| DAX 40 | −1.6% |
| FTSE 100 | −2.0% |
02 · What the news score saw
Four catalysts lifted the score — and each one triggered entries
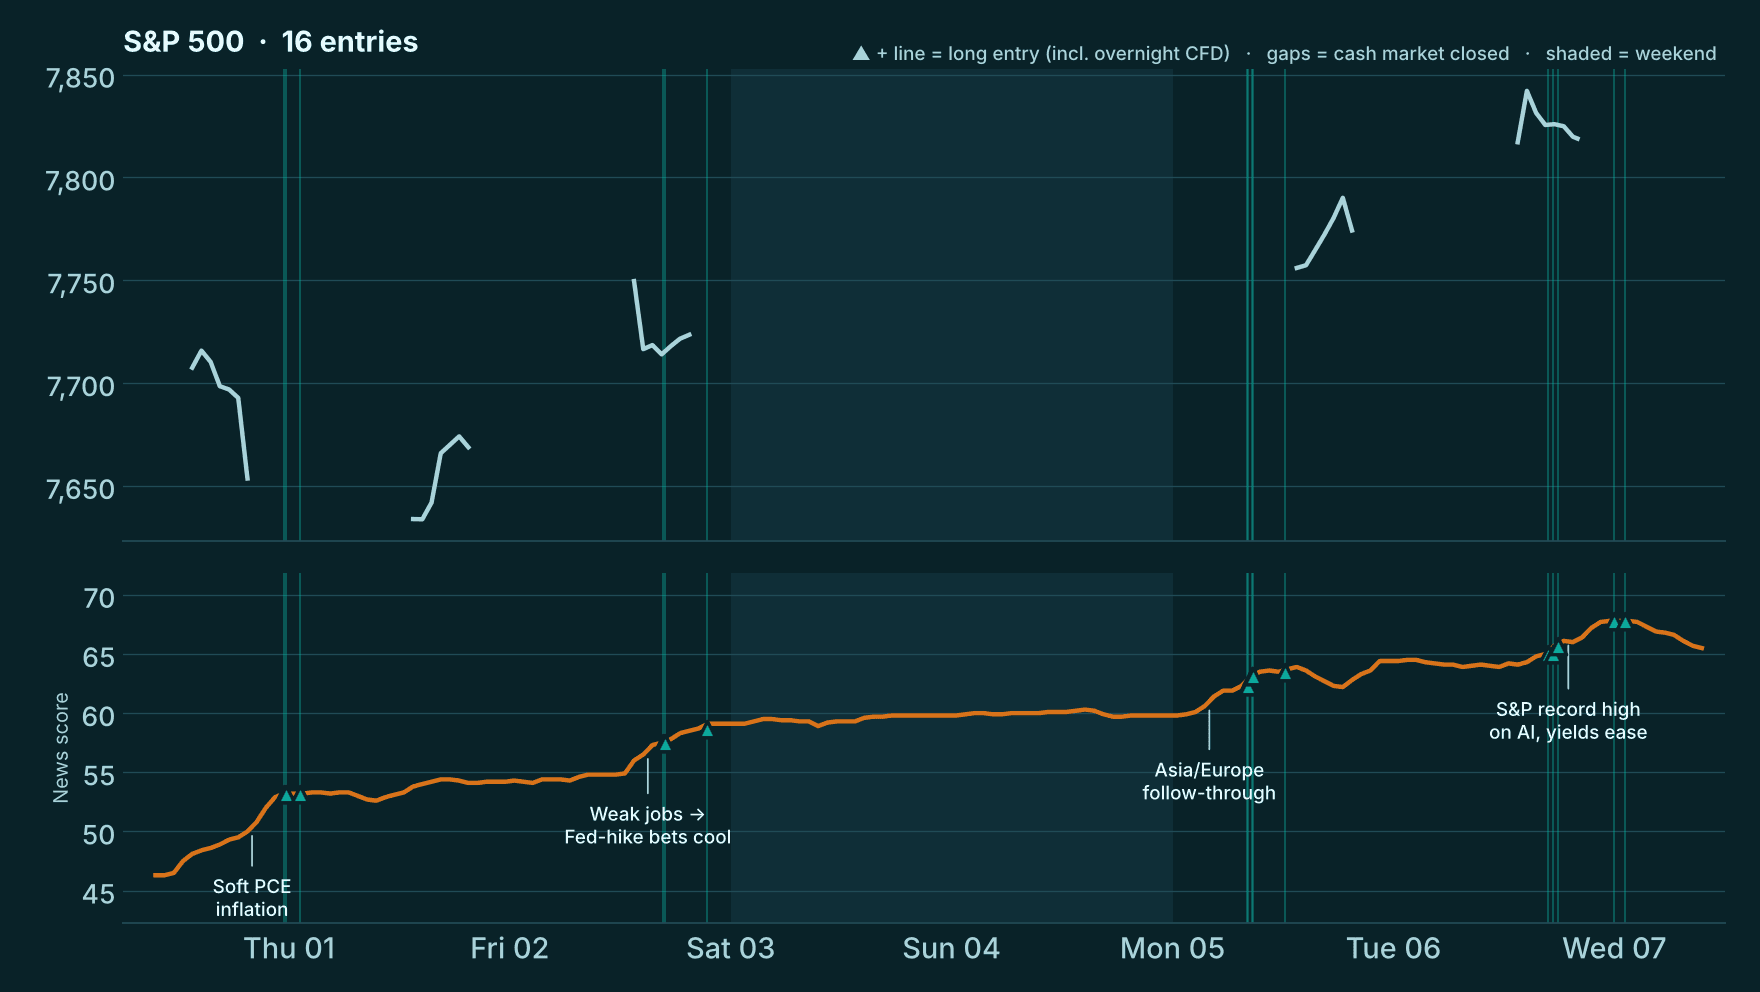
MoodVector reads thousands of headlines a day and scores each one for its likely impact on every instrument it tracks. This week the equity scores climbed in clear steps, each tied to a specific piece of news:
- S&P 46 → 53
Softer August PCE inflation. Headlines framed it as a relief rally and a step back from rate-hike fears. What we did: first long entries in the S&P 500, Nasdaq and Dow that evening.
- S&P 55 → 59
A weak jobs report, read as dovish. The Dow jumped 400 points and the Nasdaq hit a record. What we did: added steps to all three US indices through the US session.
- ASX 51 → 67FTSE 50 → 60
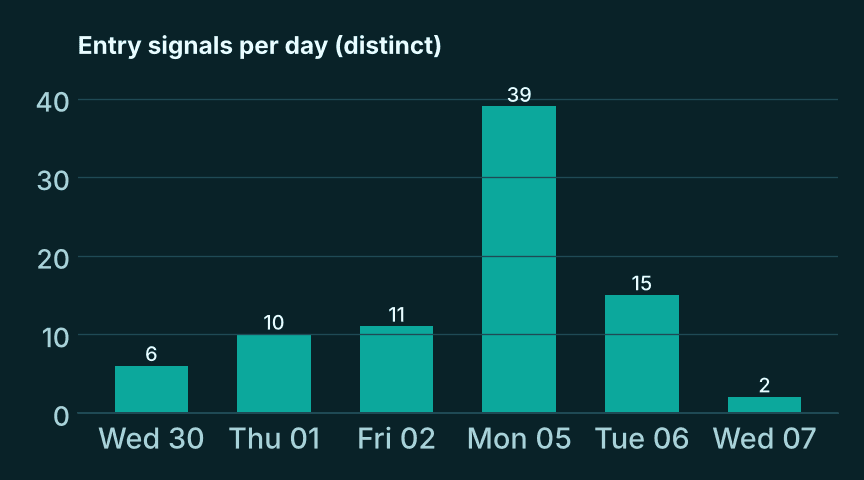
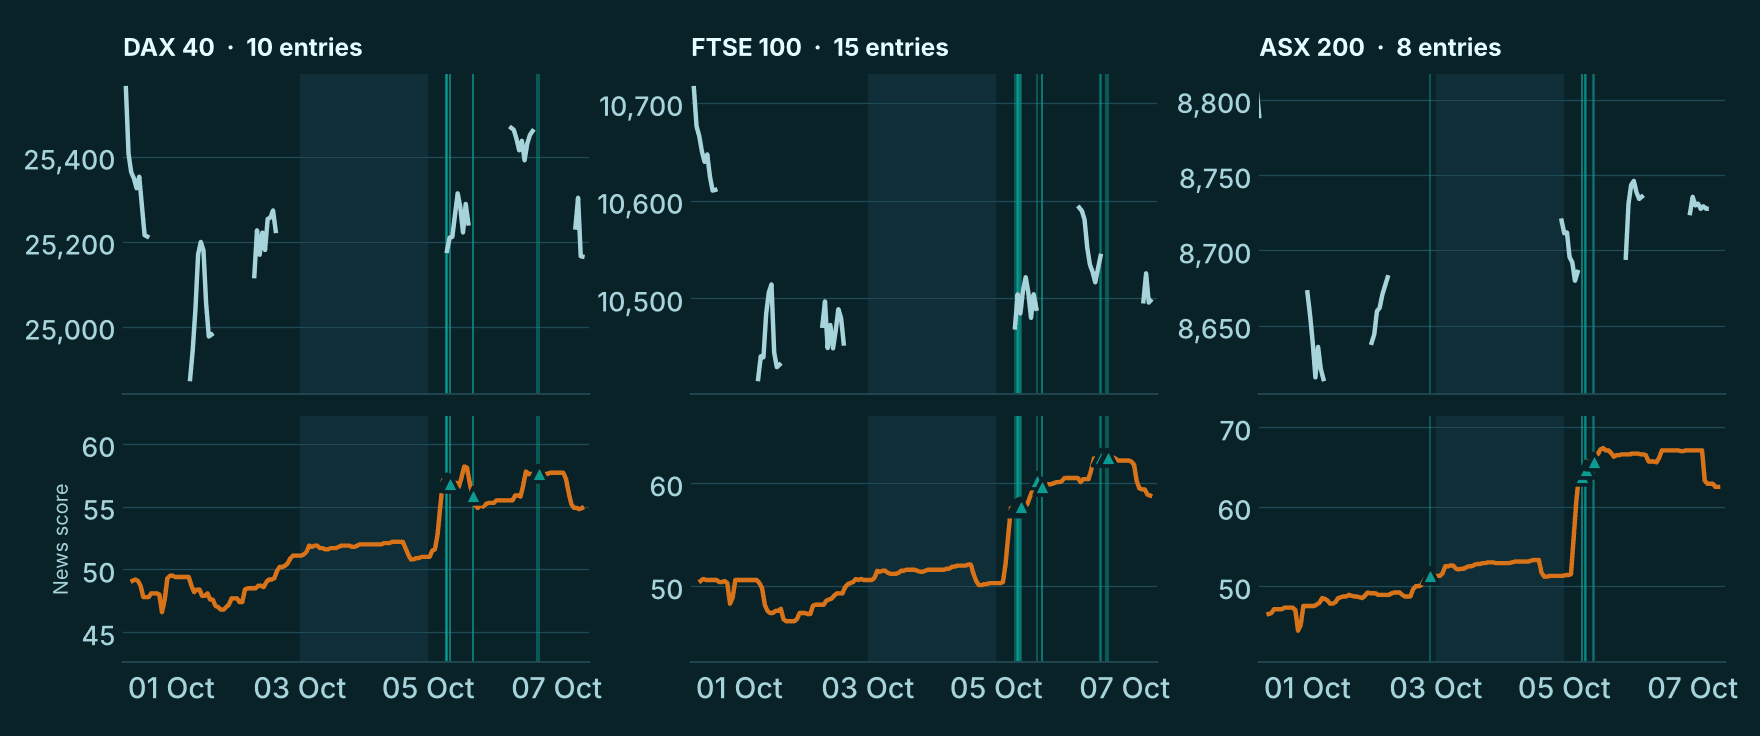
Global follow-through. Asian and European headlines picked up the "Fed-hike bets are fading" theme overnight. What we did: the busiest day of the week — 39 entry signals, opening and building positions in the ASX 200, FTSE 100 and DAX as their scores broke out.
- S&P 64 → 68
Record highs on AI, with yields easing. An oil spike briefly dragged the strategy's composite signal toward 45 in the afternoon; the per-index news scores held up, and the composite recovered to the 70s overnight. What we did: small adds through the dip, then larger S&P and Nasdaq steps overnight once the signal confirmed.
03 · How we positioned
Scaling in as conviction built
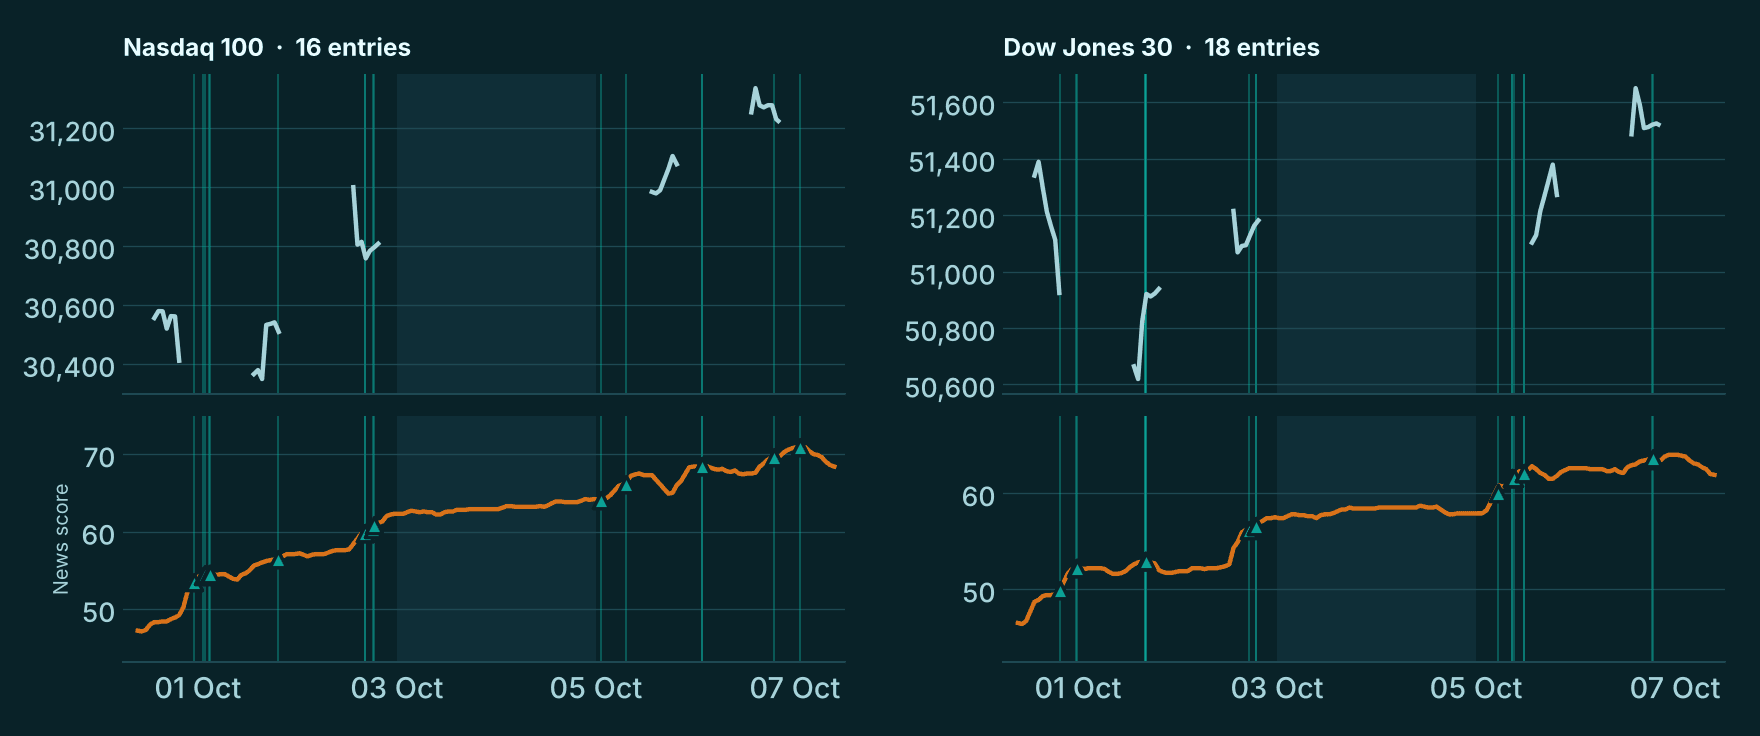
MoodVector does not go all-in on one signal. It opens a position when an instrument's score turns supportive, then adds in measured steps only while the score keeps confirming. That is why the entry lines in the charts arrive in clusters that follow the score upward, rather than as one large trade.
One detail stands out: for most of the week the CNN Fear & Greed index sat at 31 — firmly in "Fear" — while the news flow was improving. The strategy bought into that gap between mood and news. Fear & Greed had recovered to 50 by Tuesday and reads 47 today.
- 83 entry signals, all long, across 6 equity indices.
- S&P entries started at a score of 52 and added at 55, 59, 62, 66, 67 and 71.
- The small FX book was closed out on Wednesday 30 Sep; this week's risk sat in equity indices.
04 · Results
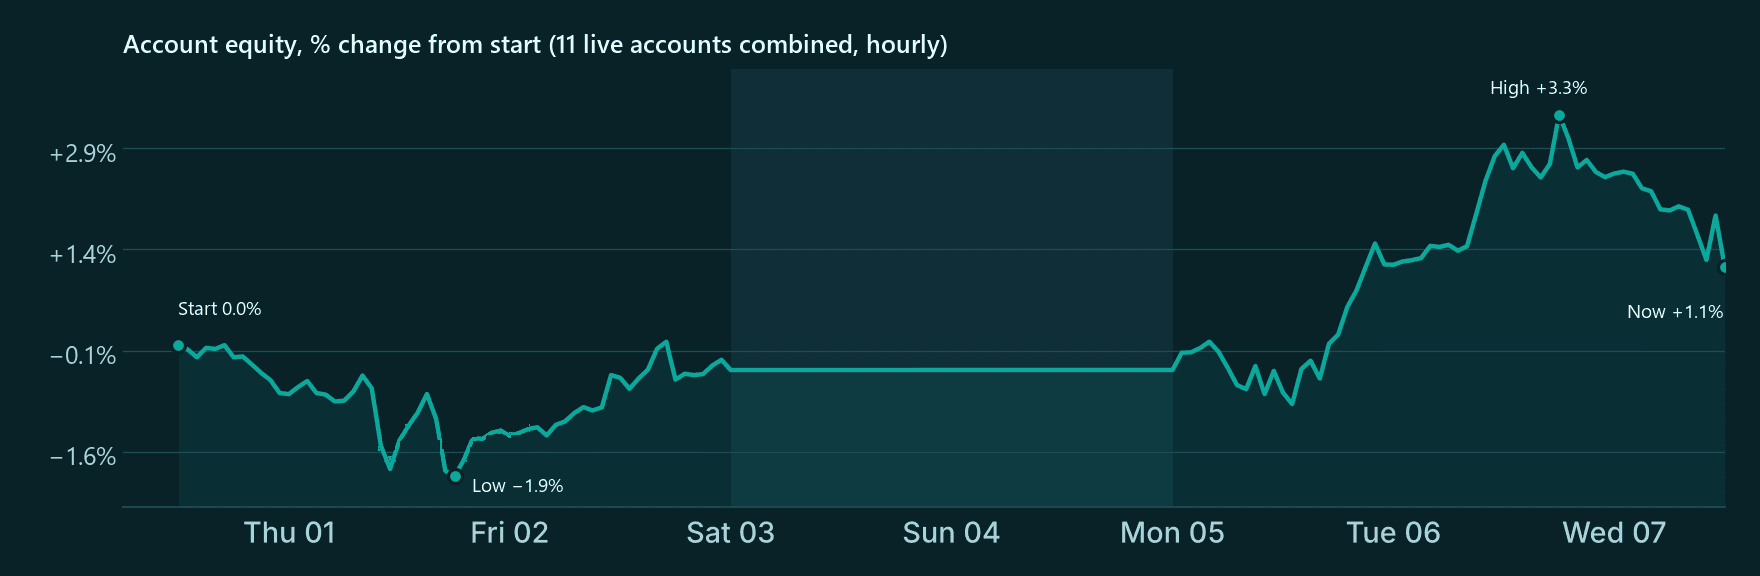
Equity up 1.1%, with drawdown kept shallow
| Measure | This week |
|---|---|
| Equity change, start → now | +1.1% |
| Deepest point (Thu 1 Oct) | −1.9% from start |
| Best point (Tue 6 Oct) | +3.3% from start |
| Realised this week | +0.4% of equity |
| Floating on open longs today | −1.1% of equity |
Being straight about it: the book gave back more than half of Tuesday's peak gain as oil and yields rose again this morning, and most open positions are slightly below their entry prices at today's levels — the European and Australian ones most. Still, the floating loss narrowed over the week, from about −1.8% of equity at the start to −1.1% now, and the strategy's step structure lets it keep holding while the news score stays supportive.
05 · What we're watching
FOMC minutes and the oil price
- FOMC minutes (today). The dovish read of this week's data is what drove the equity scores. Confirmation from the Fed would support the open longs; a hawkish surprise is the main risk.
- Brent above $100. Energy is the headwind for Europe. The FTSE and DAX positions need oil to cool for their scores to turn into price.
- The scores themselves. US scores are still in the 60s; European scores eased back into the mid-to-high 50s today. MoodVector adds only while they confirm.
Follow every trade live
The strategy behind this report runs live with a public, independently tracked record on MQL5.
Results cover the 11 live accounts running the strategy, combined, measured hourly from 30 Sep 12:00 UTC to 7 Oct 12:00 UTC, shown as percentages.
This newsletter is for information only and is not investment advice. Trading leveraged products such as CFDs carries a high risk of loss. Past performance does not guarantee future results, and floating results on open positions can change materially before they are closed.